
Earnings explainers in two minutes
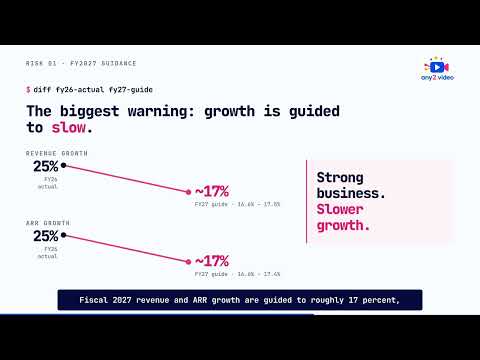
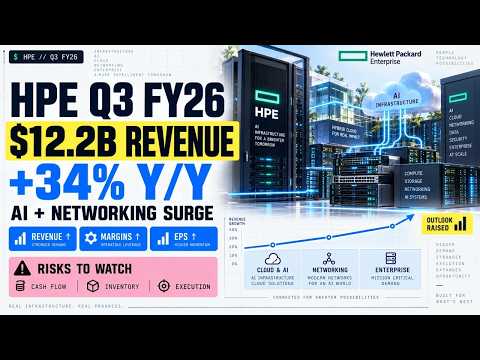
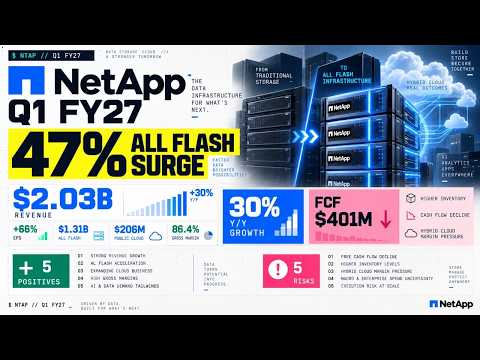
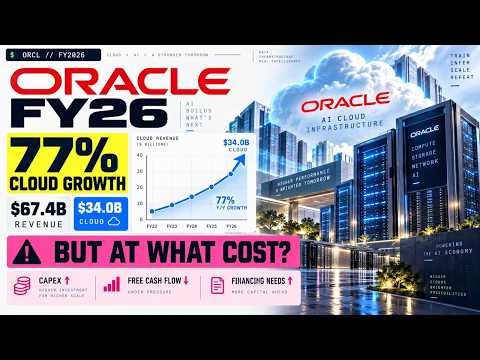
An earnings explainer turns a quarter's results, a deal or a market move into a video of about two minutes, with strengths and risks side by side. A tech company uses one in earnings week, to brief sales or partners on a competitor's quarter, or to give a newsletter something better than a press release. It summarises published numbers. It is not investment advice.
When to use it
| Who | The situation | Why this style fits |
|---|---|---|
| Competitive intelligence or product marketing | A main competitor reports its quarter, and the sales team asks what it means for open deals. | A two-minute summary of the published results, with risks next to strengths, briefs the whole team at once instead of one call at a time. |
| Alliance manager at a distributor | A vendor the distributor carries reports results, and resellers want to know whether it is safe to build a practice on. | A balanced summary of the public numbers answers that without anyone in the channel offering a view on the share price. |
| Investor relations at a listed tech company | Wants a short companion to its own results release for the investor website. | A designed summary can make the release easier to follow, provided every figure matches the filing and finance and legal approve the script first. |
| Editor of a tech market newsletter | Earnings week brings several reports in a few days, and readers want the gist of each. | The same two-minute order, positives then risks, lets readers compare companies across the week. |
| Partner marketing at an ecosystem vendor | A large deal between two companies in its ecosystem changes what customers are asking. | An explainer of what was announced, and what was not, gives customer-facing teams one shared account of the news. |
Examples
 1:49
 1:39
 1:53
 1:46
 1:45
 1:54
 1:55
 1:51
 9:23
When to use something else
- Telling anyone what to buy or sell. These videos summarise and do not advise; anything that reads as a recommendation needs a licensed adviser, not a video studio.
- Showing what your own product does. Results describe the business, not the software; a verified walkthrough is the better choice for showing the product doing a real task.
- A market story that is really one chart. An animated chart short is quicker and fits vertical feeds.
What goes into one
- About two minutes in landscape, with a vertical cut on request; longer when an IPO filing or a large deal needs the room.
- The source, the published release, filing or announcement, named on screen with its date.
- A fixed order: the headline numbers, the positives, the risks, and what to watch next.
- Narration and captions in the languages you ask for.
- From you: which report, and whether the angle is a competitor, a partner or your own company.
How we make it
- Name the report or the event, and the audience: sales, partners, investors or readers.
- We read the published release and filing, and draft a script of numbers, positives and risks.
- You, or your finance team, check every figure against the source.
- We produce it and deliver within two days, so it lands while the results are still news.
Questions
How long should an earnings video be?
About two minutes covers the headline numbers, a few positives, a few risks and what to watch. In earnings week a viewer may be following several companies, so a consistent length and order helps. A filing with more to unpack, such as an IPO prospectus, can justify a longer piece, as long as it keeps the same structure.
Is an earnings explainer investment advice?
It should not be. A good one summarises what the company published, shows risks next to strengths and recommends nothing. Ours follow that rule and carry no buy or sell view. If you publish one under your own brand, your compliance team should still read it, because the rules on financial content differ by country and by who publishes it.
Can a company make a video of its own quarterly results?
Yes, and the difference is approval. Every number must match the filing, and finance, legal and investor relations should sign off before it goes out. A designed explainer suits that, because each figure on screen is placed on purpose. For a primer on how results are reported, see GAAP vs non-GAAP explained in 60 seconds.
Related styles
- Data chart shorts in one minute: One sourced market number worth posting
- Explainers that answer one question: Answering one recurring buyer question
- 3D videos for infrastructure and maps: Showing infrastructure no camera can reach
- All 99 video examples by style
Want this style for your product? Send one product and one topic. The first sample is free.
$ get-sample →