
Data chart shorts in one minute
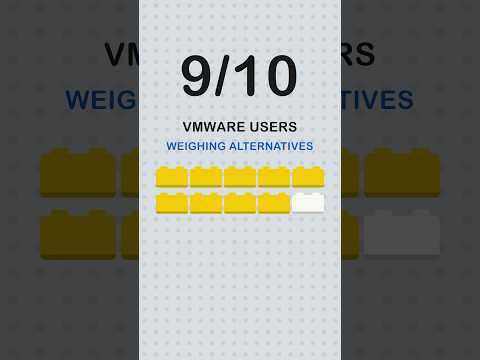
An animated chart short turns one dataset into a vertical video of about a minute: a market shift, a survey result or a monthly price series. A tech company should use one when it has a number its market cares about and a source it can name, and wants that number on LinkedIn or Shorts this week. One chart, one claim, one source line.
When to use it
| Who | The situation | Why this style fits |
|---|---|---|
| Research or analyst relations team | The company publishes a survey and wants its headline finding seen beyond the report's download page. | A one-minute chart of the main finding, with the survey named on screen, can be posted where a PDF cannot. |
| Product marketing at a challenger | Public market-share or adoption data has moved in its favour. | A chart of the shift, from a named third-party source, makes the point without the company having to claim it. |
| Team that runs a price or index page | Publishes a monthly price tracker and needs a recurring update to point people at it. | The same chart template refreshed each month turns a static page into a series with a reason to come back. |
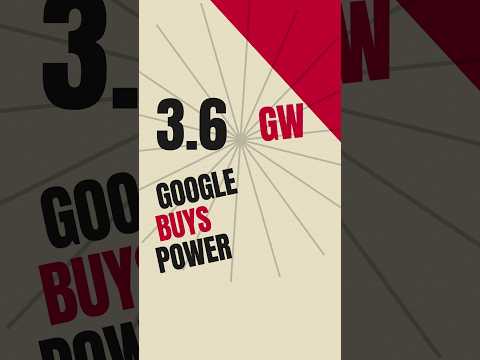
| Sales enablement | Reps need a way to open conversations about a market change, such as rising component costs or a power deal for AI data centres. | A short chart attaches to a message easily and gives the rep a fact to start from instead of a pitch. |
| Newsletter editor | Wants one visual per issue that sums up the week's biggest data point. | A chart short embeds in the issue and gets a second outing on social the same day. |
Examples
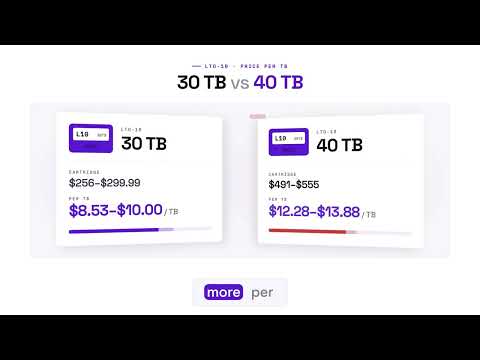 1:08




When to use something else
- Data you cannot source. A chart without a named source is an opinion with axes; publish the source first, or make an explainer instead.
- Several findings at once. One minute holds one chart; a full quarter needs an earnings explainer.
- Your own product's performance. A benchmark claim needs the run behind it, so a verified walkthrough is the better choice there.
What goes into one
- About one minute, vertical 9:16 for Shorts, Reels and LinkedIn; landscape for a web page or a recurring tracker.
- From you: the dataset or the published source, its date, and the one claim the chart should make.
- A source line on screen for every number.
- Captions throughout, with or without narration, in the languages you ask for.
- A reusable template when the chart is a monthly or quarterly series.
How we make it
- Send the data or a link to the published source, and the one sentence the chart should prove.
- We pick the chart type, check the numbers against the source and write the captions.
- You approve the frames, including the hook line and the source credit.
- You get a vertical MP4, plus the template if the chart will repeat.
Questions
How do you make a data chart video for social media?
Start from one number and one claim, not a whole dataset. Pick the chart that shows the change most simply, usually a line over time or a few bars changing places. Animate it in the order the claim is argued, put the source on screen, and keep it to about a minute in vertical format.
Can a data video use a dramatic headline?
The hook can be sharp, but it must be something the chart actually shows. If the title says a lead is almost gone, the chart has to show the gap closing, from a named source. A headline that runs ahead of its data invites corrections in the comments, which a brand account does not want under its name.
How often should a tech company post chart shorts?
As often as it has a sourced number worth reacting to, and no more. A recurring series, such as a monthly price update, sets its own rhythm. Without a dataset behind it, a weekly quota tends to produce charts of weak or recycled numbers. We cannot tell you which frequency performs best, because we have no long-run data to say so.
Related styles
- Earnings explainers in two minutes: Earnings week, competitor and partner briefings
- Tool walkthroughs, from question to result: Launching a free tool or lead magnet
- 3D videos for infrastructure and maps: Showing infrastructure no camera can reach
- All 99 video examples by style
Want this style for your product? Send one product and one topic. The first sample is free.
$ get-sample →